Disclaimer
This is an ad-hoc survey based on 54 survey respondents and 32 spousal responses. This is a low number, especially when looking at distributions of answers by the way they voted.
All but 3 of these respondents chose to remain anonymous.
I only focus on significant or dramatic survey response differences that also validate with other survey questions.
Nevertheless this set of respondents is biased in favor of those who took the time to fill out a survey on my website and should be taken with a large "grain of salt".
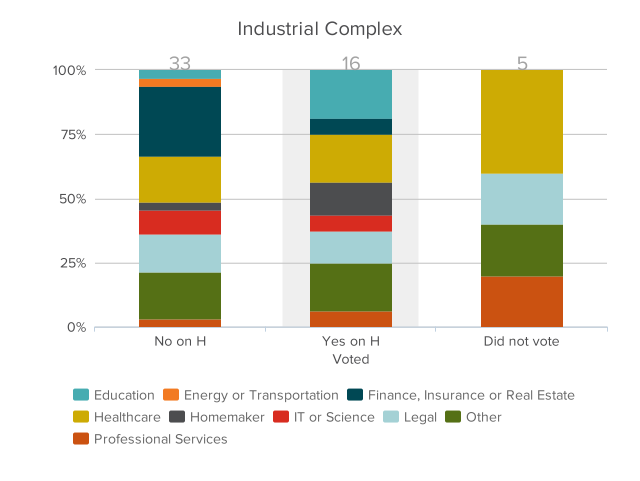
Industry
It seems a lot more Finance and Real Estate people voted “NO on H” and
perhaps understood the “comparable theater” costs and price/SF big picture
better. Homemakers and Educators tended to vote “YES on H”.
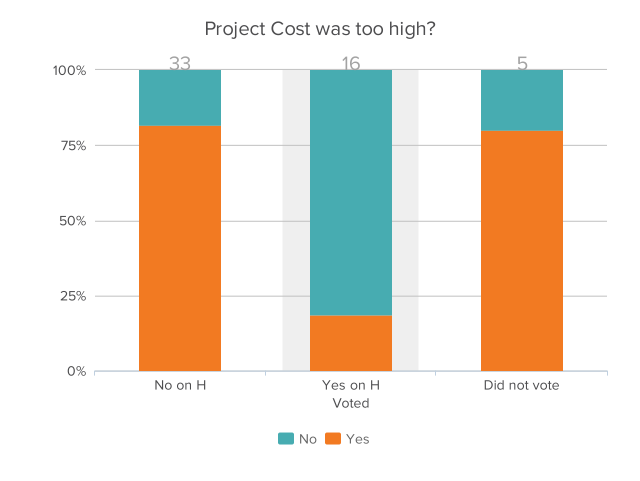
Project Cost too high?
These results match anecdotal remarks made by "NO on H" voters.
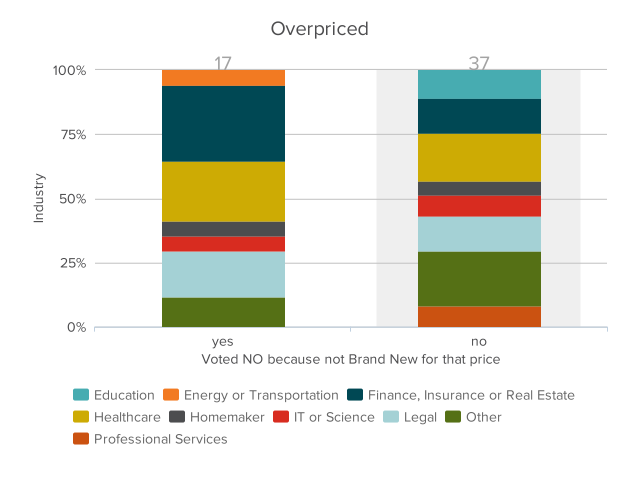
Overpriced?
I read through the reasons for the “NO on H” voters to see if they wanted a ***brand new*** theater building.
I ignored folks that wanted a brand new theater for a greater price tag. The set of "NO on H" voters that felt we could get a new building for the same price or less was approximately 50% (18/33).
I broke out these voters out by Industry (when available).
The Finance, Insurance and Real Estate (F.I.R.E.) respondents were twice as likely to agree “we could get a brand new theater for that price.” Lawyers and legal professionals were also more likely to agree with that statement. The few educators who responded, exclusively voted "YES on H".
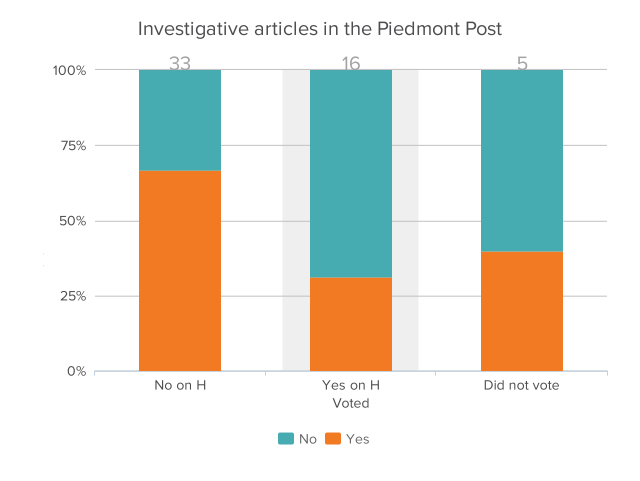
Piedmont Post Investigations
Investigative articles by Kate Fratar had a strong influence in the minds of over 50% of the “NO on H” voters. Some 30% of “YES on H” voters were influenced by those articles in favor of voting "YES on H".
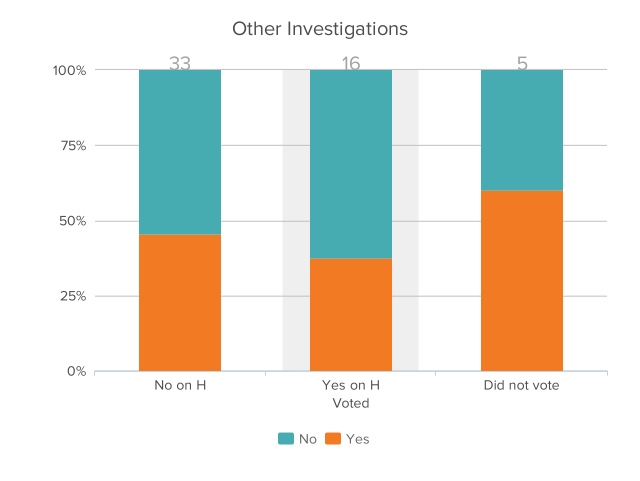
Other investigations
Of course many of the voters coming to my website to fill out the survey are going to have seen my rebuild cost analysis and the cost of going back to the drawing board.
My analysis could be used by "NO on H" voters to argue our kids deserve a better deal than this and also could be used by "YES on H" voters to argue with the designers and School Board to change their direction towards a new building option.
This chart shows how my analysis was used by a minority both sets of voters.
District FAQ
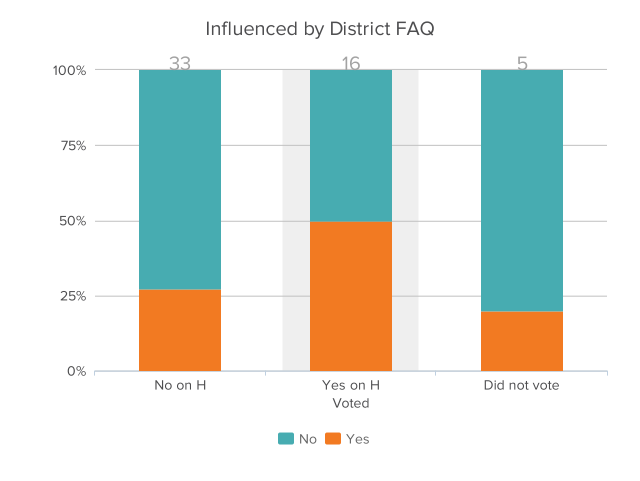
Clearly the “YES on H” voters liked the information provided by the District including their FAQ. However only 50% of them actually read those documents!
Something like 25% of the “NO on H” voters read the District documents and found them severely lacking enough to justify a NO vote.
Other Observations
Post-grads were more likely to vote "NO on H" than those who graduated college.
People "very involved" in schools were twice as likely to support the renovation.
Women were 50% more likely to vote "YES on H".
Endorsements from School Board members or City Council members had no effect on "NO on H" voters and only influenced 35% of "YES on H" voters. Endorsements from friends and family had a bigger impact (as to be expected).
